Take Control of Your Parcel Spend
Our forward-thinking Parcel Spend Intelligence technology leads the industry, empowering shippers through greater awareness.
Learn More
Compare & Contrast
Finding the Differences and Opportunities in the FedEx and UPS 2024 General Rate Increases
Talk With a Parcel Expert
We are a technology company specializing in Parcel Spend Management and Supply Chain Planning.
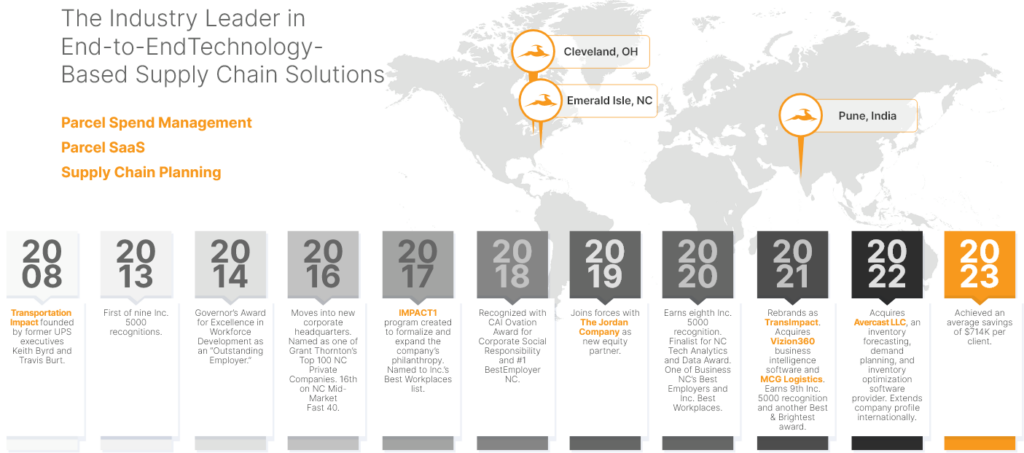
Founded in 2008, TransImpact is the industry leading supply chain technology and data firm dedicated to both cost reduction and optimization. Having pioneered the industry with our Parcel Contract Negotiation services and supporting analytics, we have saved our customers to date over $1 BILLION in spend, allowing these companies to become more profitable, proactive, and informed when making decisions about the future of their business.
0
FOUNDED
0+
EMPLOYEES
0+
0
YEARS of INDUSTRY
EXPERIENCE
$0BN
0
HARD DOLLAR
SAVINGS
0+
CLIENTS
Uncover Hard Cost Savings Immediately
We combine intelligent decision-support tools with over 800 years of market expertise to deliver practical, value-driven solutions that are transforming supply chain departments at thousands of companies.
Powered by the only re-rating engine of its kind within the industry, we identify savings with precision and accuracy, down to 1/10th of a percent. Guaranteed.
Parcel Margin Analysis
Discover the true profit margin on each product – considering gross
margin, total expense of transportation required to service the order, and revenue capture in the order process (e.g., from flat rate shipping fees).
Learn More
Parcel Cost Variance
Uncover the truth in your current spend. Expected costs and actual costs are rarely the same.
With the combination of highly intelligent decision-support technology and the market expertise of our people, we are relentless in driving bottom-line impact and turning our clients into raving fans.
TransImpact emphasizes giving and humanity.
Through IMPACT1, we invest:
0%
OF EMPLOYEE TIME
0%
OF PROFITS
0%
IN SERVICES
Employees and community members submit requests for donations, and an employee-led committee makes the decisions.
It’s all about an introduction
Become a Partner
When you introduce TransImpact to a new client we can save money, you get compensated. Augment your existing portfolio, improve value for your clients, and create a new revenue stream.